Workflow Templates Themes Adapters Quick start
LIVE SYSTEMS SYNTHETIC GEOGRAPHY
SIGNAL / 048.24
PAPERS & REPORTS FIGURES · WORDS · EVIDENCE
const view = anyviz.analyze(data); | data.map(d => d.value) [0.82, 1.49, 2.67]{ intent: "compare", context: "monitor" } | data.map(d => d.value) [0.82, 1.49, 2.67]series.map(({time,value}) => [time,value]); | data.map(d => d.value) [0.82, 1.49, 2.67]render({ theme: "dashboard", engine: "d3" }); | data.map(d => d.value) [0.82, 1.49, 2.67]01001010 0.824 32.480 0xF8EA | data.map(d => d.value) [0.82, 1.49, 2.67]await agent.visualize(question, dataset); | data.map(d => d.value) [0.82, 1.49, 2.67]const view = anyviz.analyze(data); | data.map(d => d.value) [0.82, 1.49, 2.67]{ intent: "compare", context: "monitor" } | data.map(d => d.value) [0.82, 1.49, 2.67]series.map(({time,value}) => [time,value]); | data.map(d => d.value) [0.82, 1.49, 2.67]render({ theme: "dashboard", engine: "d3" }); | data.map(d => d.value) [0.82, 1.49, 2.67]01001010 0.824 32.480 0xF8EA | data.map(d => d.value) [0.82, 1.49, 2.67]await agent.visualize(question, dataset); | data.map(d => d.value) [0.82, 1.49, 2.67]const view = anyviz.analyze(data); | data.map(d => d.value) [0.82, 1.49, 2.67]{ intent: "compare", context: "monitor" } | data.map(d => d.value) [0.82, 1.49, 2.67]series.map(({time,value}) => [time,value]); | data.map(d => d.value) [0.82, 1.49, 2.67]render({ theme: "dashboard", engine: "d3" }); | data.map(d => d.value) [0.82, 1.49, 2.67]01001010 0.824 32.480 0xF8EA | data.map(d => d.value) [0.82, 1.49, 2.67]await agent.visualize(question, dataset); | data.map(d => d.value) [0.82, 1.49, 2.67]const view = anyviz.analyze(data); | data.map(d => d.value) [0.82, 1.49, 2.67]{ intent: "compare", context: "monitor" } | data.map(d => d.value) [0.82, 1.49, 2.67]series.map(({time,value}) => [time,value]); | data.map(d => d.value) [0.82, 1.49, 2.67]render({ theme: "dashboard", engine: "d3" }); | data.map(d => d.value) [0.82, 1.49, 2.67]01001010 0.824 32.480 0xF8EA | data.map(d => d.value) [0.82, 1.49, 2.67]await agent.visualize(question, dataset); | data.map(d => d.value) [0.82, 1.49, 2.67]const view = anyviz.analyze(data); | data.map(d => d.value) [0.82, 1.49, 2.67]{ intent: "compare", context: "monitor" } | data.map(d => d.value) [0.82, 1.49, 2.67]series.map(({time,value}) => [time,value]); | data.map(d => d.value) [0.82, 1.49, 2.67]render({ theme: "dashboard", engine: "d3" }); | data.map(d => d.value) [0.82, 1.49, 2.67]01001010 0.824 32.480 0xF8EA | data.map(d => d.value) [0.82, 1.49, 2.67]await agent.visualize(question, dataset); | data.map(d => d.value) [0.82, 1.49, 2.67]const view = anyviz.analyze(data); | data.map(d => d.value) [0.82, 1.49, 2.67]{ intent: "compare", context: "monitor" } | data.map(d => d.value) [0.82, 1.49, 2.67]series.map(({time,value}) => [time,value]); | data.map(d => d.value) [0.82, 1.49, 2.67]render({ theme: "dashboard", engine: "d3" }); | data.map(d => d.value) [0.82, 1.49, 2.67]01001010 0.824 32.480 0xF8EA | data.map(d => d.value) [0.82, 1.49, 2.67]await agent.visualize(question, dataset); | data.map(d => d.value) [0.82, 1.49, 2.67]const view = anyviz.analyze(data); | data.map(d => d.value) [0.82, 1.49, 2.67]{ intent: "compare", context: "monitor" } | data.map(d => d.value) [0.82, 1.49, 2.67]series.map(({time,value}) => [time,value]); | data.map(d => d.value) [0.82, 1.49, 2.67]render({ theme: "dashboard", engine: "d3" }); | data.map(d => d.value) [0.82, 1.49, 2.67]01001010 0.824 32.480 0xF8EA | data.map(d => d.value) [0.82, 1.49, 2.67]await agent.visualize(question, dataset); | data.map(d => d.value) [0.82, 1.49, 2.67]const view = anyviz.analyze(data); | data.map(d => d.value) [0.82, 1.49, 2.67]{ intent: "compare", context: "monitor" } | data.map(d => d.value) [0.82, 1.49, 2.67]series.map(({time,value}) => [time,value]); | data.map(d => d.value) [0.82, 1.49, 2.67]render({ theme: "dashboard", engine: "d3" }); | data.map(d => d.value) [0.82, 1.49, 2.67]01001010 0.824 32.480 0xF8EA | data.map(d => d.value) [0.82, 1.49, 2.67]await agent.visualize(question, dataset); | data.map(d => d.value) [0.82, 1.49, 2.67] 2.353.524.695.877.048.219.3810.564.697.049.3811.7314.0816.4218.7721.117.0410.5614.0817.5921.1124.6328.1531.679.3814.0818.7723.4628.1532.8437.5442.2311.7317.5923.4629.3335.1941.0546.9252.7914.0821.1128.1535.1942.2349.2756.3063.3416.4224.6332.8441.0549.2757.4865.6973.9018.7728.1537.5446.9256.3065.6975.0784.4621.1131.6742.2352.7963.3473.9084.4695.0123.4635.1946.9258.6570.3882.1193.84105.5725.8138.7151.6164.5277.4290.32103.22116.1328.1542.2356.3070.3884.4698.53112.61126.6830.5045.7561.0076.2591.49106.74121.99137.2432.8449.2765.6982.1198.53114.95131.38147.8035.1952.7970.3887.98105.57123.17140.76158.3637.5456.3075.0793.84112.61131.38150.14168.9139.8859.8279.7699.70119.65139.59159.53179.4742.2363.3484.46105.57126.68147.80168.91190.0344.5766.8689.15111.44133.72156.01178.30200.5846.9270.3893.84117.30140.76164.22187.68211.1449.2773.9098.53123.17147.80172.43197.06221.7051.6177.42103.22129.03154.84180.64206.45232.2553.9680.94107.92134.90161.87188.85215.83242.8156.3084.46112.61140.76168.91197.06225.22253.3758.6587.98117.30146.62175.95205.28234.60263.9361.0091.49121.99152.49182.99213.49243.98274.4863.3495.01126.68158.36190.03221.70253.37285.0465.6998.53131.38164.22197.06229.91262.75295.6068.03102.05136.07170.09204.10238.12272.14306.1570.38105.57140.76175.95211.14246.33281.52316.7172.73109.09145.45181.81218.18254.54290.90327.2775.07112.61150.14187.68225.22262.75300.29337.8277.42116.13154.84193.55232.25270.96309.67348.3879.76119.65159.53199.41239.29279.17319.06358.9482.11123.17164.22205.28246.33287.38328.44369.5084.46126.68168.91211.14253.37295.60337.82380.0586.80130.20173.60217.00260.41303.81347.21390.6189.15133.72178.30222.87267.44312.02356.59401.1791.49137.24182.99228.74274.48320.23365.98411.7293.84140.76187.68234.60281.52328.44375.36422.28

Ask the question. Let AI draw the answer.

AnyViz helps your AI choose the right chart for the context, from a live dashboard to a figure in a paper.

Use AnyViz
↓

AI-native visualization grammar

Different contexts.
One capable AI.

A dashboard needs interaction. A paper needs restraint. AnyViz helps your AI understand the difference, select the chart and rendering tools, and carry the details through.

34 templates 4 themes 7 adapters Web / Python / R

THE REPORT STUDIO

See the whole page. Not just the chart.

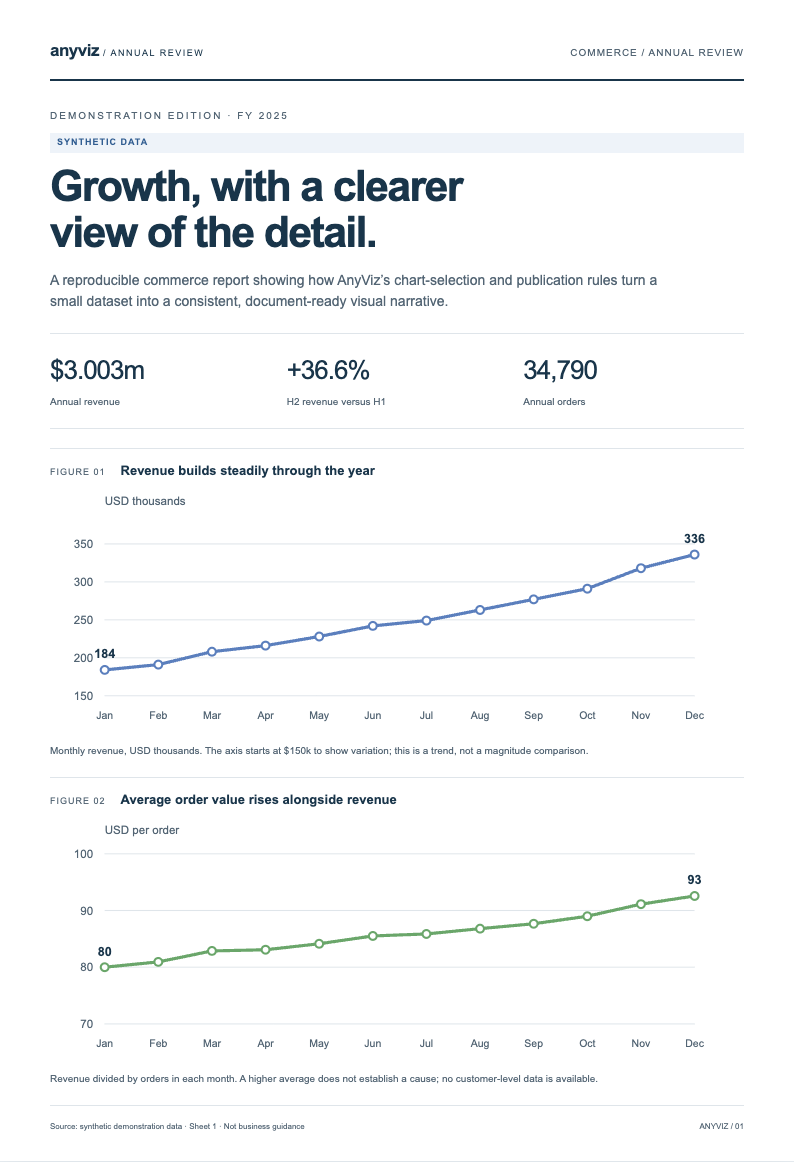
A reproducible report built from a transparent synthetic dataset. Explore six coordinated figures in context, then inspect the data and generation code.

Synthetic data · Not a customer case study · No sign-up

Preview of the AnyViz report studio: coordinated charts in a complete analytical document Open report studio

One visual language

The same entities keep the same colors across every figure.

Ready for the page

Units, captions, sources, and hierarchy stay readable together.

Open to inspection

Data and source accompany the result. Reproduce it, then make it yours.

Why anyviz

AI can draw charts, but defaults do not automatically have taste.

anyviz turns a professional visualization designer's judgment into executable rules: which chart fits the data, which theme fits the context, and how multiple charts keep color, type, spacing, and annotation consistent.

It is not a single charting library. It is a visualization grammar that spans D3, ECharts, Plotly, Matplotlib, ggplot2, and more.

Workflow

A five-stage pipeline turns taste into a repeatable process.

Analyze -> Aesthetics -> Adapt -> Consistency -> Accessibility. Every step has rules, and every output can be explained.

01

Analyze

Identify data shape, analytical intent, and audience context before deciding whether to chart and which chart to use.

02

Aesthetics

Apply theme palettes, type scale, grids, line width, radius, and data-ink rules.

03

Adapt

Choose D3, ECharts, Mapbox, Three.js, Plotly, Matplotlib, or ggplot2 for the project environment.

04

Consistency

Keep entity colors, annotation formats, axes, and legend strategies consistent across charts.

05

Accessibility

Check contrast, color-blind safety, redundant encoding, and readable annotations so meaning never depends on color alone.

Templates

34 templates make chart choice a deterministic decision.

From comparison, distribution, relationship, composition, trends, maps, hierarchy, flow, and 3D scenes, anyviz maps analytical intent to production-ready templates.

Themes

Four themes for web products, reports, dashboards, and papers.

Sales analysis canvas modern

Trend

Share

Region

Heat

Correlation

Adapters

One spec, seven rendering engines.

D3Web default

Highly customizable, zero-dependency, pixel-level control.

EChartsWeb dashboard

Fast interactive charts and industry dashboards.

MapboxGeospatial

Geospatial data, choropleths, and flow maps.

Three.js3D

3D scatterplots, surfaces, and immersive visualization.

PlotlyPython interactive

The default for Jupyter and interactive analysis.

MatplotlibPython static

Publication, papers, and static high-resolution output.

ggplot2R statistics

Declarative grammar for statistical graphics.

Natural language

One sentence maps to consistent aesthetic parameters.

Natural language does not override every style. It changes a few high-level intents while the rest inherits from the global spec.

modern default
Examples

Not isolated charts, but a coordinated canvas.

Start

Give AI an executable visualization taste.

prompt
Visualize this sales dataset
Use the anyviz dashboard theme
Output ECharts code and explain the chart selection rationale
Keep colors, type sizes, and label formats consistent across all charts
javascript
import modern from "anyviz/aesthetics/themes/modern.json";

const palette = modern.color.categorical.palette;
const lineWidth = modern.chart.line.stroke_width;
bash
python3 scripts/theme_validator.py \
  -c examples/test_config_valid.json
LLM context

The site root includes structured `llms.txt`.

It describes anyviz capabilities, workflow, themes, adapters, natural-language controls, resource links, and AI usage guidance in plain text for crawlers and LLMs.

Read llms.txt

What would you like to visualize?

Keep AnyViz close. Star the repository to save it for your next visualization project.

Star AnyViz on GitHub